7.2 ggplot2
Draw the Indometh graph using ggplot2:
# First, activate the ggplot2 library
library(ggplot2)
ggplot(Indometh, aes(factor(time), conc, col = Subject, group = Subject)) +
    geom_line() +
    labs(x = "Time (h)", y = "Concentration (mcg/ml)",
         title = "Indometh Pharmacokinetics") +
    theme(plot.title=element_text(size=20,face="bold"))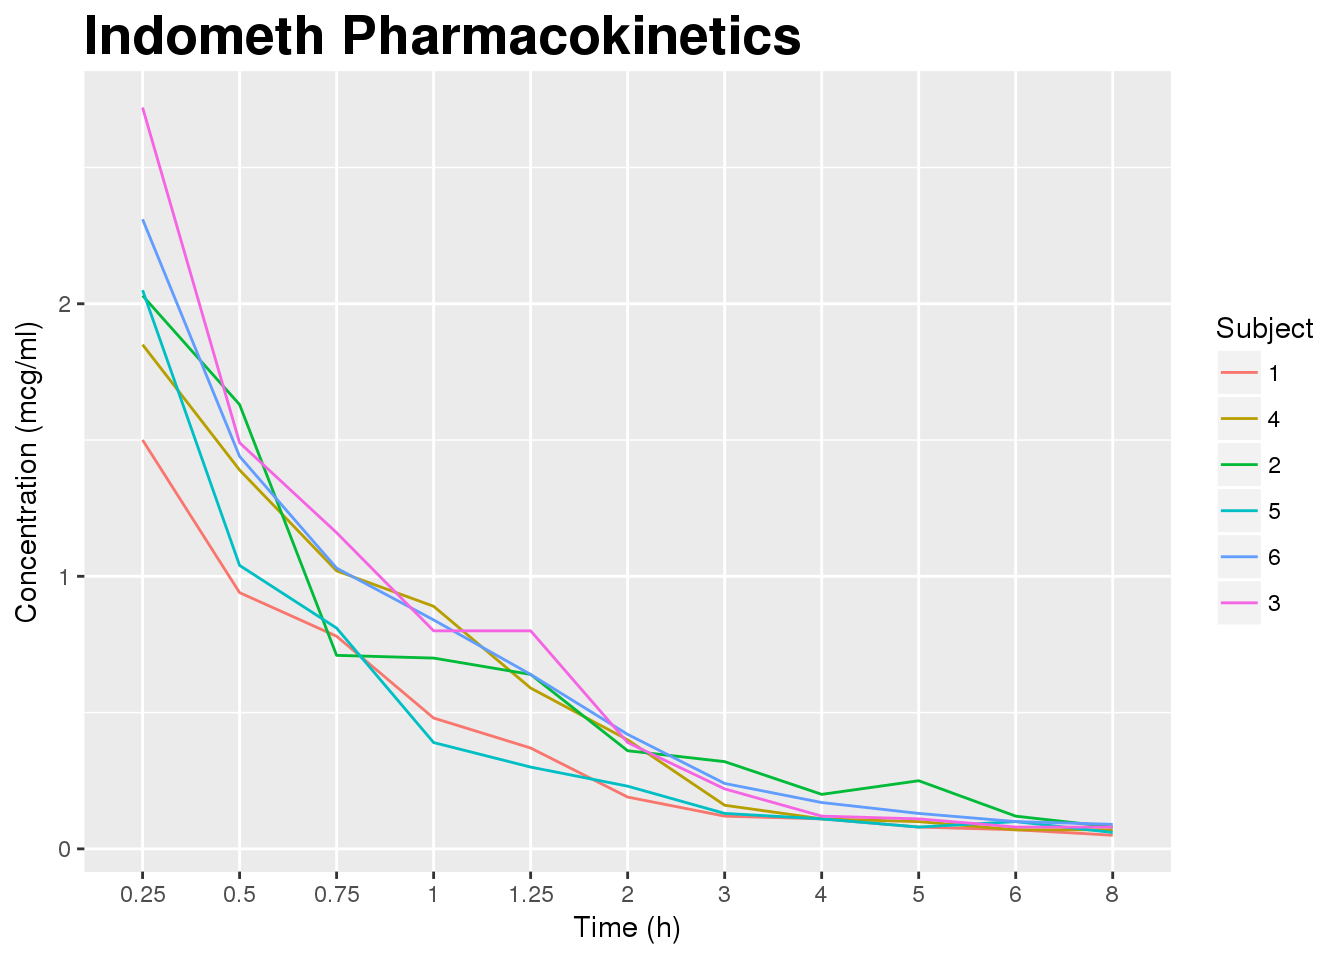
What’s happening here?
| Function/Argument | Description |
|---|---|
aes |
sets the aesthetics of the plot. In this case, that we want to plot ’time’ on the x-axis (the factor), ’conc’ on the y-axis, and group and colour the lines by ’Subject’ |
goem_line() |
specifies that this is a line plot |
labs() |
sets the x and y axis labels and the plot title |
theme() |
in this case defines the plot title as bold 24 point |
+ |
plut signs at the end of the lines tells R that the command hasn’t finished and that it continues on the next line |