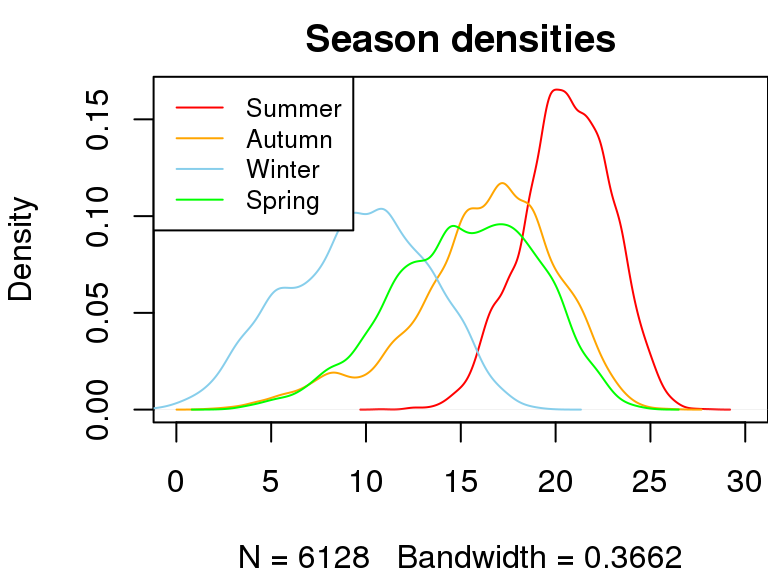
7.3 Density plots
Another alternative for histogram plot is to use the density plot. See plot(density(x)) where x is the vector of numbers like the one used in hist() above. Since density plots are lines, we can plot multiple densities onto the one graph:
par(mar=c(4,4,2,0))

first.season <- levels(seasons)[1]
for(season in levels(seasons)) {
  keep.rows <- seasons == season
  temp <- as.matrix(minTemp[keep.rows,])

  if (season == first.season) {
    plot(density(temp, na.rm=T),xlim=c(0,30), col=season.col[[season]],
         main="Season densities")
  } else {
    lines(density(temp, na.rm=T),xlim=c(0,30), col=season.col[[season]])
  }
}
legend('topleft',
       legend=levels(seasons),
       lty=1,
       cex=0.8,
       col=as.character(season.col))